> ## Documentation Index
> Fetch the complete documentation index at: https://docs.getkadabra.com/llms.txt
> Use this file to discover all available pages before exploring further.
# Monitor a Flow
> Inspect run history, errors, and node level performance
# How to Monitor a Flow
Use the **Monitor** page to see how your automation behaves over tim
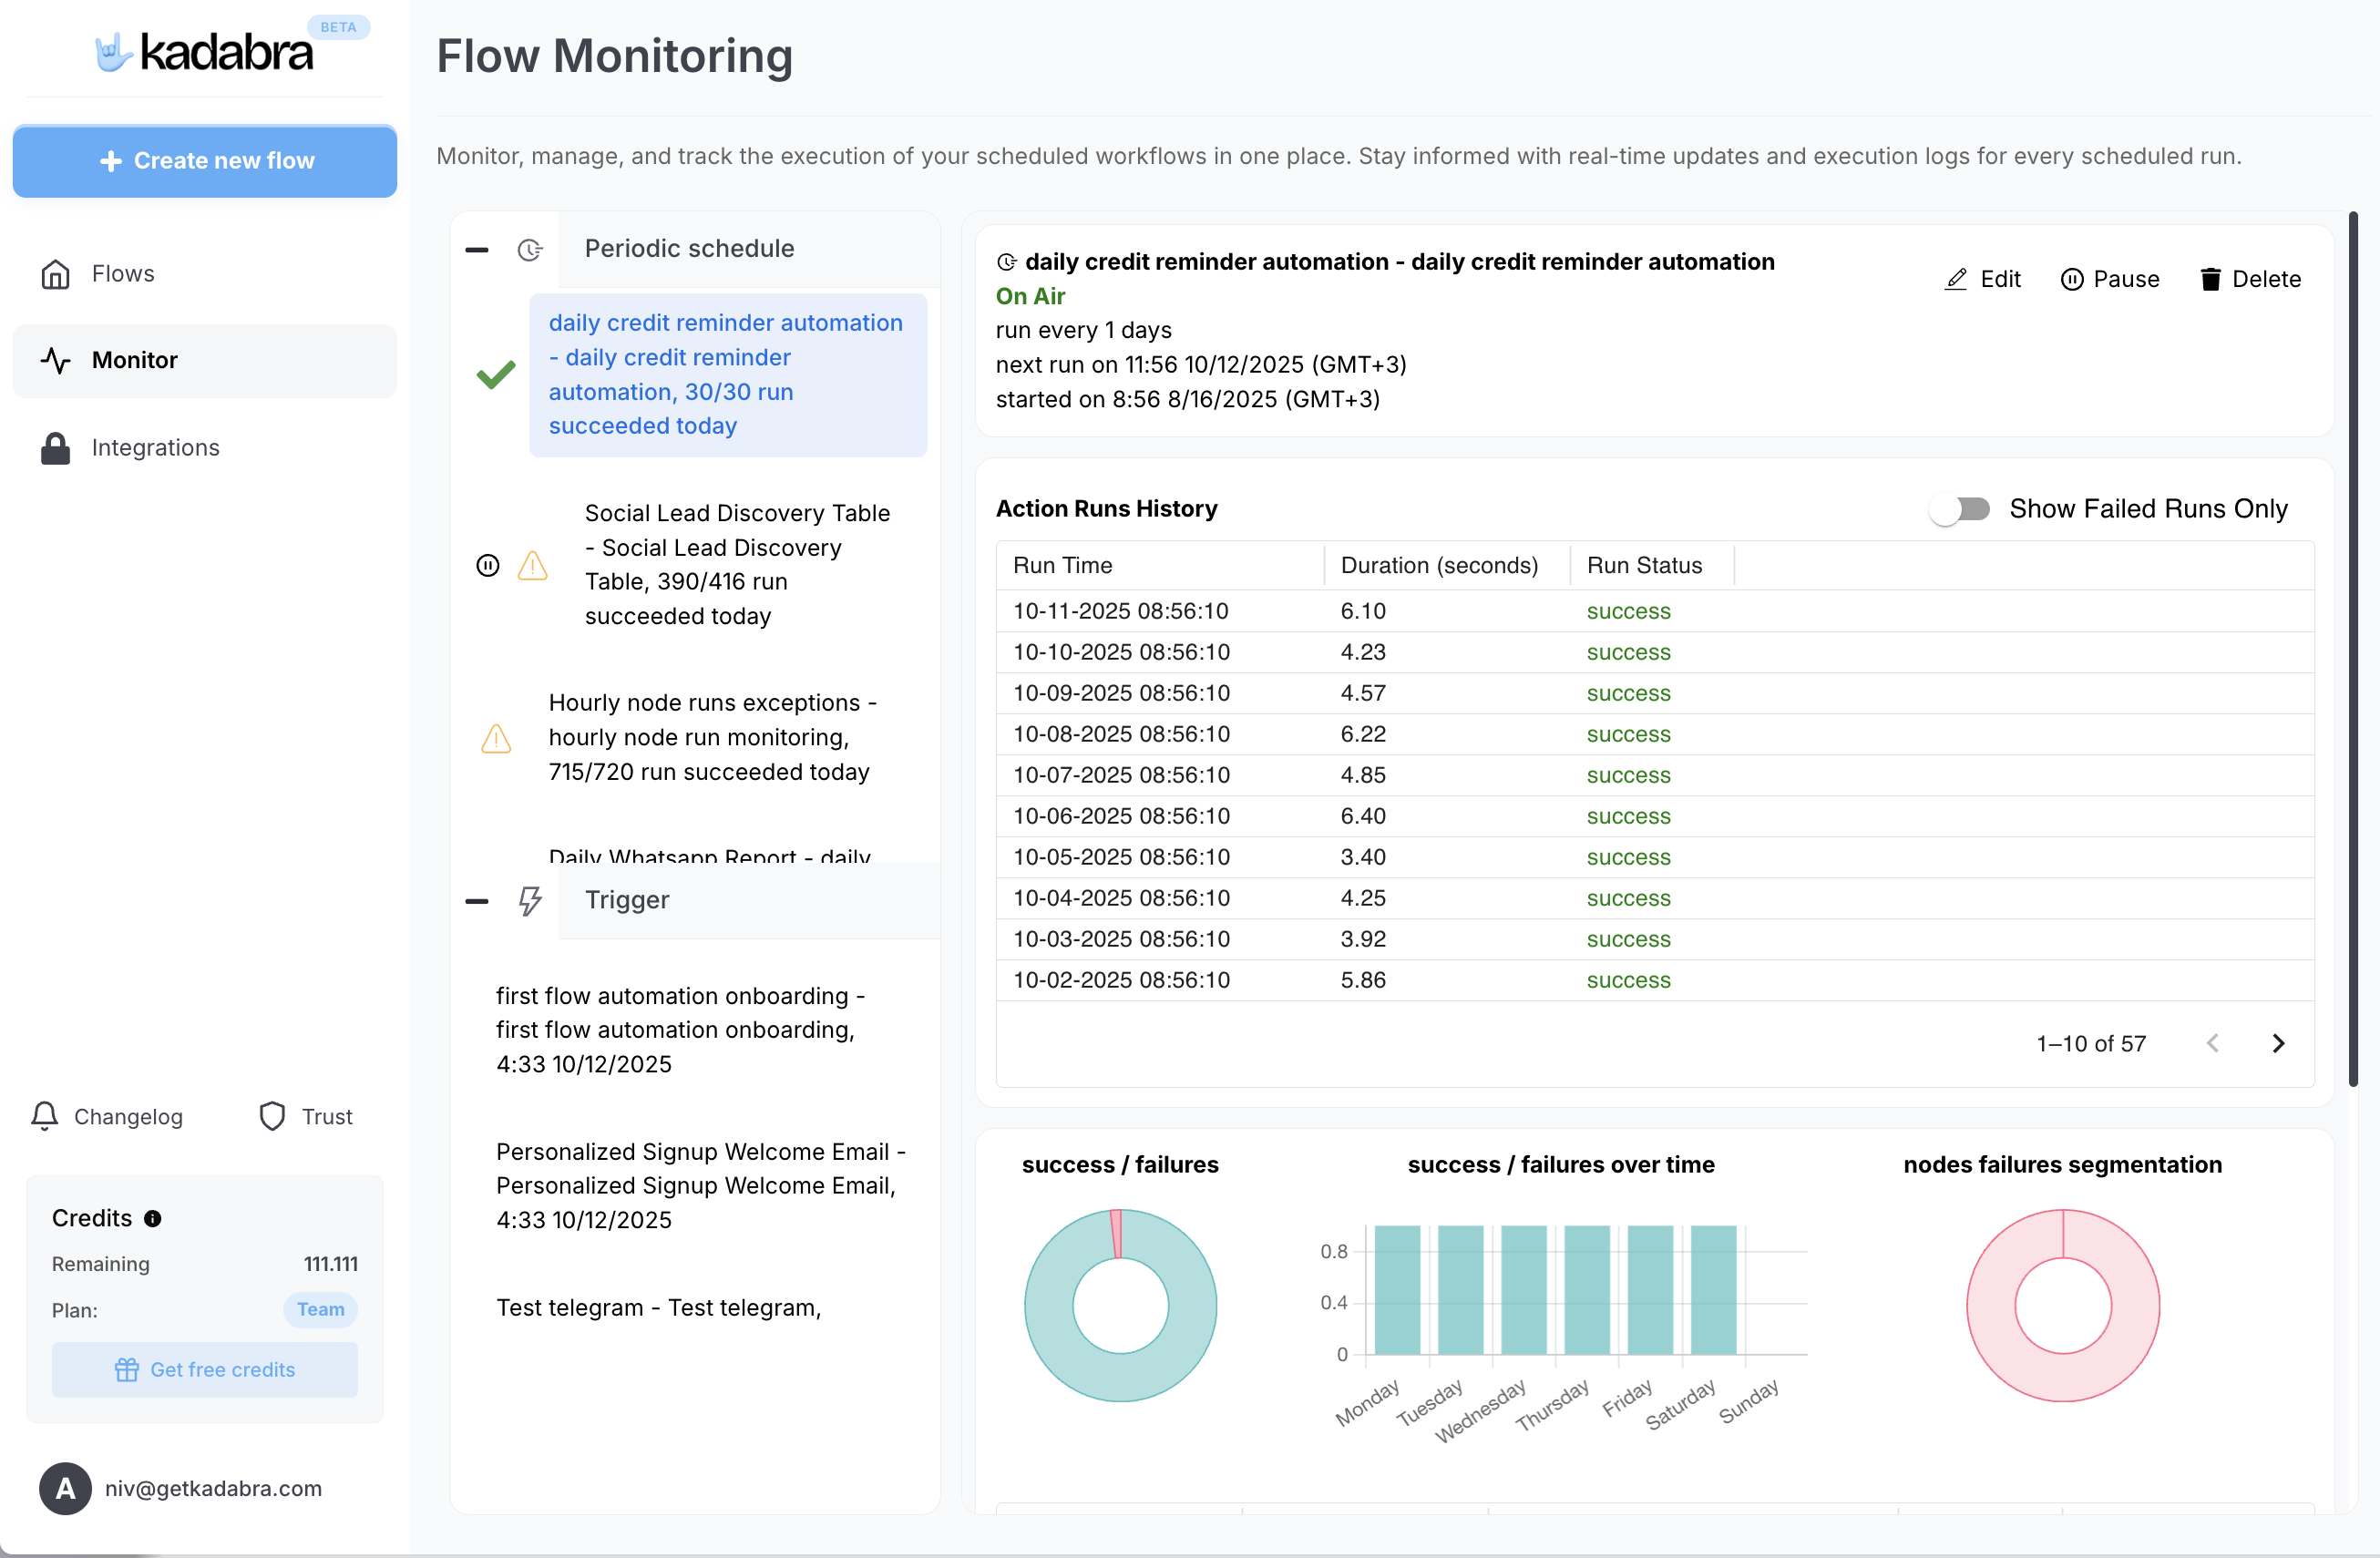 ## What you can see
* Run status - success or failure
* Runtime and throughput
* Per node execution breakdown
* Error messages with suggested fixes
Pro Tip: Set up a monitoring flow that listens to run events and alerts you in Slack when a run fails or exceeds a latency threshold.
## What you can see
* Run status - success or failure
* Runtime and throughput
* Per node execution breakdown
* Error messages with suggested fixes
Pro Tip: Set up a monitoring flow that listens to run events and alerts you in Slack when a run fails or exceeds a latency threshold.